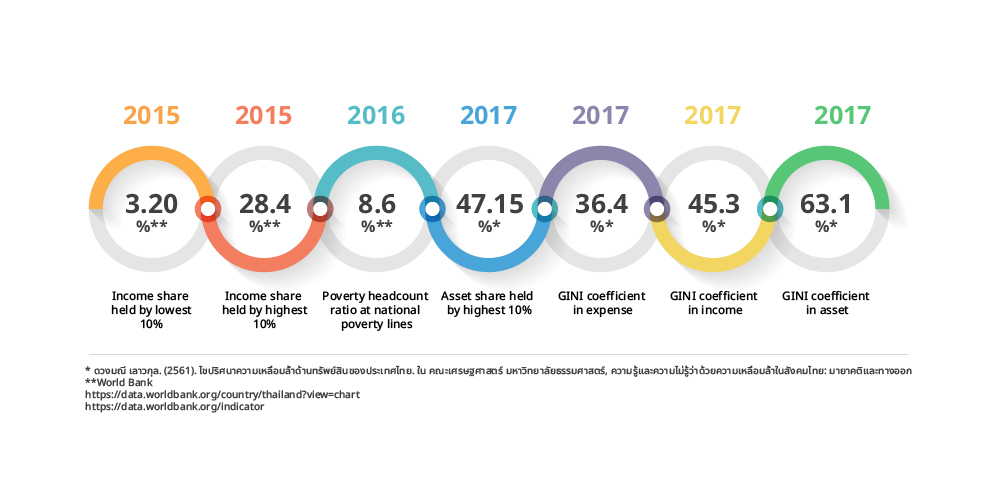
GINI coefficient in asset, 2017 63.1%*
GINI coefficient in income, 2017 45.3%*
GINI coefficient in expense, 2017 36.4%*
Asset share held by highest 10%, 2017 47.15%*
Poverty headcount ratio at national poverty lines, 2016 8.6%**
Income share held by highest 10%, 2015 28.4%**
Income share held by lowest 10%, 2015 3.20%**
* ดวงมณี เลาวกุล. (2561). ไขปริศนาความเหลื่อมล้ำด้านทรัพย์สินของประเทศไทย. ใน คณะเศรษฐศาสตร์ มหาวิทยาลัยธรรมศาสตร์, ความรู้และความไม่รู้ว่าด้วยความเหลื่อมล้ำในสังคมไทย: มายาคติและทางออก
**World Bank
https://data.worldbank.org/country/thailand?view=chart
https://data.worldbank.org/indicator